
By Marina Akhavein
Data visualization produces images from data that can highlight trends, outliers, and patterns. For UC Santa Barbara digital media professor, George Legrady, data visualization is an artform. He is an internationally-recognized artist and researcher who is offering a data visualization course this winter.
Legrady’s course is part of the Media Arts and Technology graduate program and revolves around artwork that he installed at the Seattle Public Library in 2006. He receives data from all of the items checked out from the library by the hour, creating a cultural map of peoples’ interests by what they are reading. Keywords in multiple colors from titles that were checked out can be seen floating across six screens above a reference desk, showing a visual of what is circulating in the library. Legrady’s students interpret this data in visual language and make it into impactful art by analyzing the trends, outliers, and patterns over time.
Legrady, who runs The Experimental Visualization Lab at UCSB, recently sat down virtually from his studio in Santa Barbara for an interview to discuss the impact of the pandemic on his data visualization course, and the art world in general.

UCSB Professor of Data Visualization, Chair of Media Arts and Technology Graduate Program, and artist, George Legrady.
Q: Tell me about your data visualization course. Has it changed with the pandemic?
A: I started it in 2006 when I installed the artwork at the Seattle Public Library. The first step [for students] is to come up with an interesting question about the data. One possible question might be to search for certain patterns or correlations with world events. We have a 14-year history, so we can predict what might happen. For the second half of the course, students explore their own data. What’s interesting is that the data in March went [down] because the library closed, but people still had stuff at home. It will be interesting to see how the COVID situation has impacted the data.
Q: We hear the term “big data” thrown around a lot recently. Have you implemented big data in some of your art? Have technological advancements in machine learning helped you accomplish some of your projects?
A: I’ve done a lot of projects with big data and I am actually writing a paper where I discuss big data from the point of view of the arts as opposed to science. We are actually seeing a lot of projects right now giving attention to global warming. One of the interesting things from an aesthetic point of view is how you translate numeric data into visual expression and also to what point you can make an interesting work out of this. Much of these projects were in the form of interactive exhibits in museums.
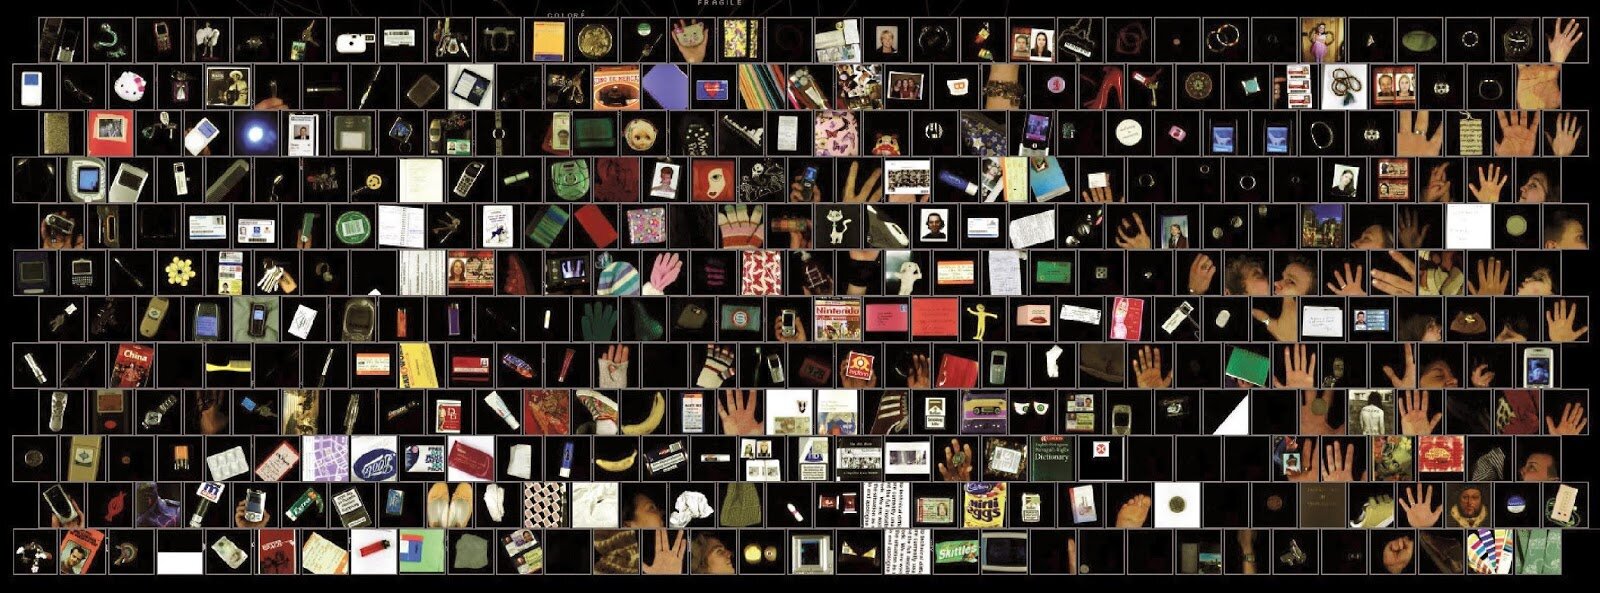
UC Santa Barbara professor George Legrady’s Interactive Exhibit Pockets Full of Memories at the Centre Pompidou in Paris (2001).

Legrady's Anamorph-Rust (2020), Composition with rust textures based on anamorphic perspective and Voronoi tessellation.
Q: How do you think that the art world will change with more remote viewing and how has this situation affected you?
A: Today we have cameras in every computer so the current situation allows for expanded explorations of internet art. However, there’s a big difference between you walking into a museum and facing a 20-foot screen and facing this little screen. For my own production, I kind of like sitting here so that’s been great. I also work with my students; they are part of my projects but all the interactions happen like this [on Zoom].
Marina Akhavein is a third-year UC Santa Barbara student pursuing a Bachelor of Science in biopsychology. She wrote this piece for her Writing Program class, Journalism for Web and Social Media.